


Economics Dissertation, ECON3001, 2020-21
Chris Hyland, 14328066
Abstract
Regulators, sector leaders, and campaign groups alike are increasingly urging UK charities to increase the age and gender diversity of their trustee boards. Claims proliferate that doing so will improve their performance and thus their impact. Prior empirical evidence for these claims is sparse and like much non profit governance research it principally relies on surveys that are small, unrepresentative, and cross-sectional. For this paper, I construct a novel panel dataset of 10,696 large English and Welsh charitable companies from 2007-18. I do not find robust evidence of a link between trustee age or gender and charity financial performance, and I show that effects in line with previous research are not robust to the inclusion of charity fixed effects or the use of instrumental variables. Using a complementary propensity score matched difference in-differences design, I find no statistically significant effect of recruiting a first trustee aged under 31 on total income, voluntary income, or the ratio of charitable expenditure to total income. More broadly, my dataset construction approach may allow other charity governance questions to be re-addressed with panel data methods.
Acknowledgements
Iam grateful to Seung-Keun Martinez, Juergen Amann, Thomas Chen and Markus Eberhardt for helpful discussions and comments. I also thank Zainub Absar for proofreading in line with university policies.
Word count: 7,500
Supervisor: Seung-Keun Martinez
This Dissertation is presented in part fulfilment of the requirement for the completion of an undergraduate degree in the School of Economics, University of Nottingham. The work is the sole responsibility of the candidate. I do give permission for my dissertation to be made available to students in future years if selected as an example of good practice.
Table of contents
1. INTRODUCTION ………………………………………………………………………………………………………………………..
2. LITERATURE REVIEW ………………………………………………………………………………………………………………….
2.1 THEORETICAL FRAMEWORKS ………………………………………………………………………………………………………………..
2.2 EMPIRICAL EVIDENCE: FOR-PROFIT FIRMS …………………………………………………………………………………………………
2.3 EMPIRICAL EVIDENCE: NON-PROFITS ………………………………………………………………………………………………………
3. DATA AND VARIABLES ……………………………………………………………………………………………………………….
3.1 DATA …………………………………………………………………………………………………………………………………………..
3.2 VARIABLE SELECTION …………………………………………………………………………………………………………………………
3.3 DESCRIPTIVE STATISTICS ……………………………………………………………………………………………………………………
4. METHODOLOGY ………………………………………………………………………………………………………………………
4.1 CORE MODEL ………………………………………………………………………………………………………………………………..
4.2 PROPENSITY SCORE MATCHED DIFFERENCE-IN-DIFFERENCES ………………………………………………………………………….
5. RESULTS ………………………………………………………………………………………………………………………………..
5.1 CORE MODEL ………………………………………………………………………………………………………………………………..
5.2 PROPENSITY SCORE MATCHED DIFFERENCE-IN-DIFFERENCES ………………………………………………………………………….
5.3 ROBUSTNESS AND EXTENSIONS …………………………………………………………………………………………………………..
6. DISCUSSION ……………………………………………………………………………………………………………………………
7. CONCLUSION ………………………………………………………………………………………………………………………….
8. REFERENCES …………………………………………………………………………………………………………………………..
9. APPENDIX ………………………………………………………………………………………………………………………………
1. Introduction
20% of the adult population in England and Wales are aged 18-29 (ONS, 2019). However, only 2% of the trustees who govern and direct their 168,000 registered charities, usually as volunteers, fall in the same bracket (Charity Commission, 2010, 2018a). The Charity Commission (2010, p. 4) actively wishes “to encourage young trusteeship, and to help to create more diverse boards”, and the Charities Aid Foundation (2015, p. 3) describes the average age of trustees being 57 as “extremely worrying”. A ‘Young Trustees Movement’ (2019) aims to double the number of trustees aged under 31 by 2024. These organisations claim young trustees strengthen decision-making by bringing more diverse experiences, increase public support by visibly increasing representation, and contribute insights and technological capabilities to engage broader donor and beneficiary groups (Charity Commission, 2010; Charities Aid Foundation, 2015). To the best of my knowledge, however, no prior empirical evidence from the UK, and none internationally attempting causal identification, tests these claims of a link between younger trustees and charity performance, on which official recommendations are being based. My dissertation fills this gap, focusing on financial performance. In a sector whose workforce is 65% female, only 34% of the trustees of large charities are women (Inclusive Boards, 2018). I therefore also examine links between female trustees and financial performance. By studying English and Welsh charitable companies, the structure adopted by most large charities, I construct a novel panel dataset of 10,696 charities from 2007-18 that is substantially larger and richer than previously used in this literature. Using a pooled OLS specification I can replicate results from prior research, including findings that age-diverse non-profit boards are associated with greater donations, and gender-diverse with lower (Siciliano, 1996). These effects disappear when including charity fixed effects, and when instrumenting for age and gender to mitigate endogeneity. Neither have been done before in this literature, as far as I am aware. I instrument for female representation using the proportion of male trustees sitting on other boards with a female director, and for age with the proportion of trustees aged 31 or over sitting on other boards with a trustee aged under 31. I find no robust, statistically significant effect of the proportion of female trustees, the proportion of trustees aged under 31, the standard deviation of age or mean age on charities’ total income, voluntary income, or the ratio of charitable expenditure to total income.
Using a complementary propensity score matched difference-in-differences design, I compare the performance of charities which recruit their first ever trustee aged under 31 with that of those that have never had a young trustee. Across a variety of matching procedures, I find no consistent statistically significant effect of first young trustees on the same financial performance measures. My research thus suggests that some assumptions underlying charity trustee diversity recommendations should be re-evaluated. It also demonstrates the importance of using panel data in the non-profit governance literature for more credibly causal identification and establishes an accessible and replicable means of obtaining it. The paper proceeds as follows. Section 2 surveys prior theoretical and empirical literature. Section 3 details the data sources and key variables. Section 4 introduces both central empirical methodologies, and Section 5 their key results with an array of robustness checks. Section 6 discusses these results and Section 7 concludes.
2. Literature review
2.1 Theoretical frameworks
As directors of profit-making firms and trustees of non-profits alike are often older and male, theoretical approaches to the effect of young and female board members on performance usually concern age and gender diversity. Carter et al. (2010) argue that the strongest theoretical link comes from resource dependence theory (Pfeffer & Salancik, 1978), which suggests boards facilitate connections with external bodies holding crucial resources. Non-profit literature calls this “boundary spanning”, with fundraising a common example (Callen et al., 2009). Hillman et al. (2002), suggest a taxonomy of board member types that provide different resources. This implies the diverse information sets and connections of younger or female trustees can source more valuable resources from more sources, improving financial performance (Carter et al., 2010). Increased diversity itself may also raise organisational legitimacy (Hillman et al., 2007). Other theories are less equivocal. Younger trustees are likely to have less training and experience and so less human capital (Borjas, 2016), but might contribute unique forms of human capital by being more agile and energetic (Mishra & Jhunjhunwala, 2013). Social psychology theories suggest board diversity could both encourage innovation and slow decision-making (Carter et al., 2010). Overall, theory inconclusively predicts the effects of young and female trustees on non-profits’ financial performance. Notably, Hermalin and Weisbach (2005) suggest that if organisations are in equilibrium, rationally optimising their boards, empirical relationships between board characteristics and performance are spurious. The empirical literature rarely addresses this. I propose that evidence that young people often lack accurate information about trusteeships, and that some older trustees resist younger members (Charity Commission, 2010), may imply current disequilibrium. I return to this when discussing my results.
2.2 Empirical evidence: for-profit firms
Empirical non-profit literature is “often a step behind” (Garcia‐Rodriguez et al., 2020, p. 2) that studying firms, and the effect of age and gender diversity on non-profits’ performance is especially underexplored (Stone & Ostrower, 2007). I will therefore first summarise relevant firm-related literature. Plentiful research tests the relationship between female directors and firm performance but, as Table 1 demonstrates, results are highly inconsistent. Post & Byron’s (2015) meta-analysis of 140 studies finds a positive relationship on average between female directors and accounting-based performance measures like return on assets (ROA), but none with market-based assessments. Endogeneity likely partly explains conflicting results. Both omitted variable bias, perhaps due to firm culture affecting gender diversity and performance, and simultaneity bias, as women may be more likely to apply to and/or be selected by high-performing firms (Smith et al., 2006), are likely. Various mitigation strategies have been implemented. Adams and Ferreira (2009) instrument for female directors using the proportion of male directors sitting on another board with female representation. They argue that this is a proxy for informal social connections that help women into power without independently affecting performance. Studying 1,939 US firms, they show that a positive female-performance link from pooled OLS regression disappears when using fixed effects, instrumental variable, or system GMM estimation. Natural experiments, 4 such as the Norwegian gender quotas exploited by Ahern and Dittmar (2012), provide the most credibly causal evidence but are rare. A much smaller literature examines director ages and firm performance. As Table 2 illustrates, these are also inconclusive. Talavera et al. (2018), studying 97 Chinese banks, is perhaps the most plausibly causal. Using fixed-effects estimation, instruments of the age diversity in surrounding provinces and similarly sized banks, and two-step system GMM estimation, they find a negative relationship between the coefficient of variation of director age and both ROA and return on equity.
2.3 Empirical evidence: non-profits
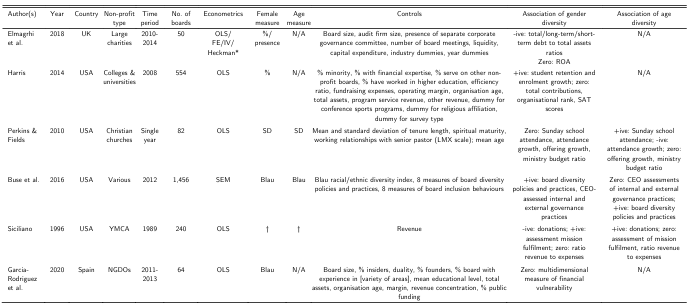
Table 3 outlines the much scarcer (Stone & Ostrower, 2007) non-profit literature. Causal identification is rarely addressed and, as per the broader non-profit governance literature, papers typically rely on cross sectional surveys of particular regions or organisation types (Cornforth, 2012). Siciliano (1996) investigates associations between board diversity and performance using a survey of 240 US YMCA non-profits. Partial correlations, controlling for revenues, show age diversity is associated with higher donations. However, it has no significant correlation with consultant-assessed social performance or fiscal performance (revenue ÷ expenses). Gender diversity is related to lower donations and greater social performance but not to fiscal performance. Although an influential early contribution, the single control makes omitted variable bias probable. However, to the best of my knowledge, it remains the only research linking board member age to non-profits’ overall performance, except Perkins and Fields’ (2010) study of 82 churches which includes no organisation-level controls and likewise is cross-sectional. Harris (2014), with a larger cross-sectional sample and many more controls, makes some progress regarding gender diversity. They find a positive effect on the student retention and enrolment growth of US universities, but none on other performance indicators. However, the author admits it cannot be interpreted causally. The research most similar to mine is Elmagrhi et al. (2018), who manually transcribe annual reports from 2010-14 of 50 of the UK’s largest charities. They primarily use pooled OLS estimation, but to reduce endogeneity they also try fixed effects estimation, two-stage least squares estimation (2SLS), and a Heckman selection model. When performing 2SLS they do not use an instrument, running a first stage merely on the controls, achieving little. Their two-stage Heckman model corrects for trustee self-selection using the proportion of women in each charity’s industry to predict female trustee recruitment. The model assumes errors from each stage have a bivariate normal distribution (Bascle, 2008), so using this as an instrument in 2SLS may have been preferable. They find that female trustees, particularly up to a ‘critical mass’ of three, are associated with reduced short-term and total debt. They fail to find a direct effect of the proportion of female trustees on ROA, but only test this using pooled OLS regression. Further, ROA is not a financial performance measure charities commonly use (Boateng et al., 2016). Trustee ages are not considered, presumably as they are not published.
TABLE 1 — KEY EMPIRICAL RESEARCH OF THE LINK BETWEEN FEMALE BOARD MEMBERS AND FOR-PROFIT FIRMS’ PERFORMANCE

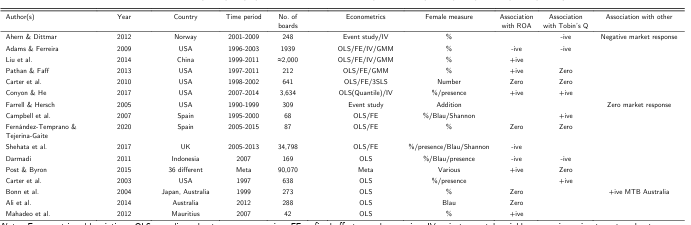
TABLE 2 — KEY EMPIRICAL RESEARCH OF THE LINK BETWEEN BOARD MEMBER AGE AND FOR-PROFIT FIRMS’ PERFORMANCE

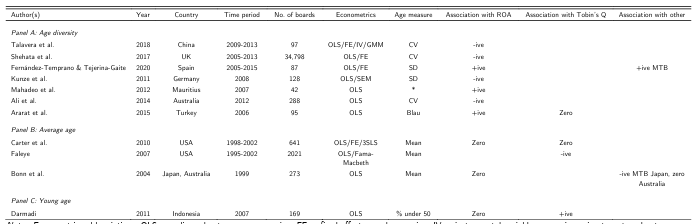
TABLE 3 — KEY EMPIRICAL RESEARCH OF THE LINK BETWEEN TRUSTEE GENDER OR AGE DIVERSITY AND NON-PROFITS’ PERFORMANCE

3. Data and variables
3.1 Data
To overcome the data limitations typically constraining non-profit governance research, I identified that although the Charity Commission merely publishes current trustee names, Companies House publishes the names, titles, nationalities, and dates of birth of past and present company directors. Many charities, including 78% of the largest 4,000 by income (Charity Commission, 2020a), are charitable companies. For these, “trustees are the directors of the company” (Charity Commission, 2005a). I therefore match the charity register (Charity Commission, 2020a), which includes detailed finances since 2007 for charities with annual income over £500,0001, with Companies House data. I have not encountered previous research doing this. This creates an unbalanced panel from 2007-18 of 10,696 charitable companies with annual income over £500,000: 79,417 charity-year observations.
I source some Companies House data from the Fame database (BVD, 2020). However, 1% of relevant birthdates are missing. Additionally, constructing my instrumental variables requires data on all directors at other companies that trustees in my sample are also on the boards of, which Fame cannot provide. I therefore built a Python wrapper for the Companies House (2020) API itself, based on that by Mistler (2018). My scripts ran for several days, due to rate-limiting and the hundreds of thousands of requests necessary. Appendix 1 has full details.
I classify 85.9% of trustee genders using titles (Mr, Mrs, etc.), and the remainder based on first names using Genderize.io (Demografix ApS, 2020). Wais (2016, p. 36) finds Genderize.io to be “the best currently available approach.”
3.2 Variable selection
Given varying missions and strategies, “the non-profit sector has no accepted universal measure of success” (Crutchfield & Grant, 2012, p. 328). Boateng et al. (2016) investigate which performance measures 105 large British charities use in practice, finding charitable expenditure ÷ total income definitively the most common. Therefore, I use this ‘spending ratio’ as one financial performance measure. A greater ratio is generally perceived as favourable, though this can depend on a charity’s strategy (Sayer, 2018). Some charities secure lump-sum grants or endowments that are spent over several years, distorting this statistic, so I confirm my core results are insensitive to averaging it over 2, 3 or 4 years (Appendix 2). I use total income, which Boateng et al. (2016) find is also widely used, as a second performance measure with a clearer interpretation. I adopt voluntary income as the third to allow comparisons with prior literature and because resource dependence theory perhaps implies reaching new donor groups is a particularly credible channel through which diverse boards might impact financial performance. I express both in natural logarithms due to their strong positive skew. 14.7% of voluntary income observations are zero, so I recode these as one before taking the logarithm. Just 12 raw observations have voluntary income of one, so this causes negligible distortion. My results are not sensitive to instead excluding observations with zero values 1From “part b” returns. I identified around fifty entry errors in this data while investigating outliers, which I corrected using annual reports or other Charity Commission records.
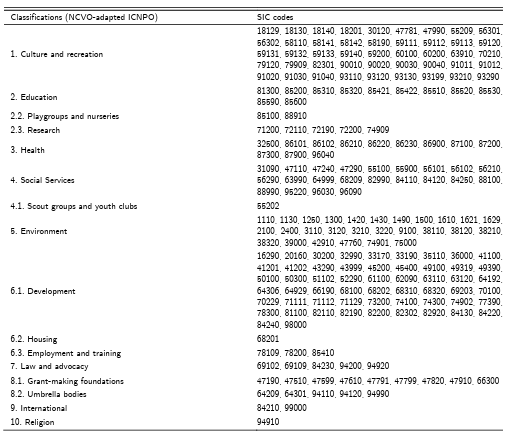
or using the inverse hyperbolic sine transformation which avoids recoding but is less readily interpreted (Appendix 3). Following most of the literature (Darmadi, 2011), I use the proportion of trustees who are women to measure female presence. I test three age explanatory variables in turn. The proportion of trustees aged under 31 captures young trusteeship, standard deviation of age captures age diversity, and mean age the overall youth of a board. Selecting a ‘youth’ threshold is inevitably somewhat arbitrary. I choose under 31 to coincide with the Young Trustees Movement’s (2020) targets. I control for log board size, the proportion of non-British trustees, leverage, and log total assets as a charity size proxy. All are common in firm board diversity research (e.g. Adams & Ferreira, 2009; Campbell et al., 2007). Non-profit literature often includes a dummy for operating only in one area (e.g. McDonnell & Rutherford, 2019), whereas I have created a more granular set of dummies representing working in one local authority, throughout Greater London, UK-wide, or internationally. The Charity Commission does not report any unique classification per charity, so I create a mapping of company SIC codes to the NCVO (2020) variant of the ICNPO non-profit classifications to control for 16 charity types (Appendix 4). The NCVO have a dataset classifying every charity more rigorously that they are willing to share but could not compile in time for this paper.
3.3 Descriptive statistics
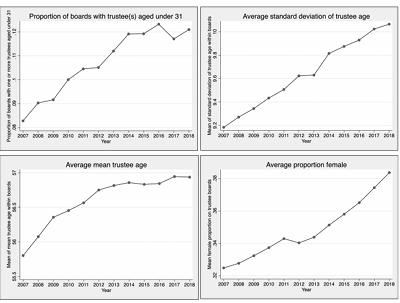
Table 4 summarises all variables employed, and Table 5 contains the means of key variables by charity classification. Scout groups and youth clubs have the greatest proportion of young trustees, with a mean proportion of trustees aged under 31 of 7% against a 2% sample-wide mean. Figure 1 shows the age profile of all trustees active in 2018. Figure 2 visualises how the four explanatory variables have evolved 2007-18, suggesting young trustees and female trustees are increasingly common, though mean age has risen.
TABLE 4 — SUMMARY OF VARIABLES

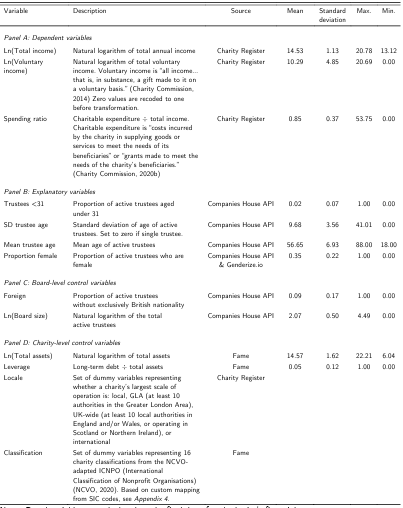
TABLE 5 — DEPENDENT AND EXPLANATORY VARIABLE MEANS BY CHARITY CLASSIFICATION

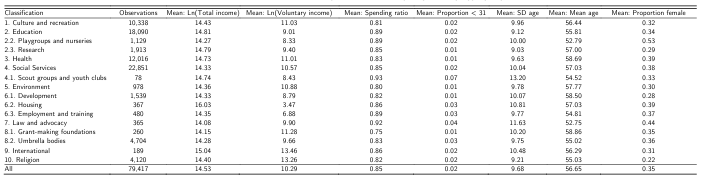
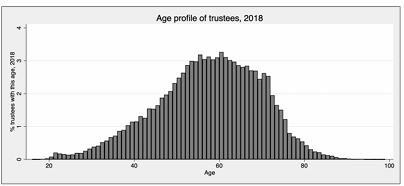

FIGURE 2 — TRUSTEE AGE AND GENDER TRENDS IN SAMPLED CHARITIES, 2007-18

4. Methodology
4.1 Core model
My core empirical specification is thus:
!”#$%&’!”=)#+)$+,%-./01#!(“&$)+)($&2/!%3!(“&$)+45!(“&$)+602710%!+870199!+:”+a!+<!”
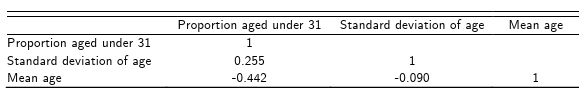
I test each of the three financial performance measures (FinPerf) with each of the three age-related
explanatory variables (AgeExplan) in turn due to inevitable high multicollinearity, as per Table 6. The
resulting nine combinations mean I must interpret statistical significance in the context of the multiple testing
problem.
My core empirical specification is thus:


TABLE 6 — CORRELATION MATRIX OF AGE EXPLANATORY VARIABLES

X is a vector of controls, while locale and class are sets of geographic scale and ICNPO classification dummies, excluding base groups. :” are year fixed effects, a! charity fixed effects, and <!” idiosyncratic errors. In line with much existing literature (e.g. Carter et al., 2010; Fernández-Temprano & Tejerina-Gaite, 2020), all
independent variables are lagged by one year. Because they are defined at the end of each charity’s financialyear this is intuitively reasonable: when lagged they represent the situation at the start of the year over which financial performance is measured. Arguably (Reed, 2015), lagging also helps mitigate simultaneity bias (Liu et al., 2014). I show pooled OLS and random effects results but emphasise fixed effects estimation. This eliminates the confounding unobserved a!, though also removes the time-invariant locale and class dummies. As endogeneity likely remains, I instrument the proportion of female trustees using the proportion of male trustees sitting on another company board with at least one female director. Instruments are exogenous variables that affect the dependent variable solely (‘exclusion restriction’) through their effect on the endogenous regressor (‘relevance’). This instrument was first proposed by Adams and Ferreira (2009) in the most cited paper in the board diversity literature, and it is now widely used2 (e.g. Levi et al., 2014). They suggest it is a proxy for informal social connections that help women into power. Adams and Ragunathan (2017), adopting a similar instrument, argue these connections better enable male directors to identify appropriate female candidates, and improve inter-gender trust. These factors are likely more significant for charities, 81% of which recruit trustees by word of mouth and personal recommendation (Charity Commission, 2005b). Though reasonable justifications of instrument relevance, those Adams and Ferreira (2009) offer of exogeneity and the exclusion restriction are less concrete. They argue the instrument’s correlation with an organisation’s connectedness to other organisations is mitigated by organisation fixed effects and controlling for board size. They further show results are robust to controlling for total external board seats. I suggest that other, untestable, possibilities remain. Male board members’ preponderance for tolerance and inclusion, as reflected in the gender balance on other boards on which they sit, could foster an organisational culture that directly affects financial performance, for example. Nevertheless, while its estimates should be treated cautiously, the instrument has sufficient plausibility to warrant inclusion. Similarly, I instrument the age explanatory variables using the proportion of trustees aged 31 or over who sit on another board with a member aged under 31. Experience working with younger directors may make them better able and more willing to recruit young trustees.
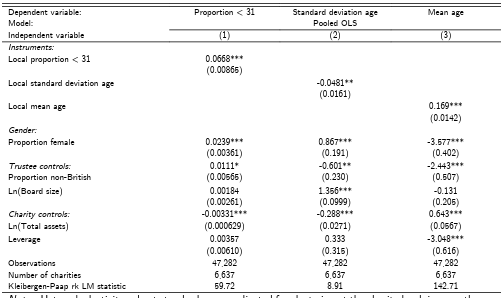
I explored other instruments. Following Liu et al. (2014) and Talavera et al. (2018) I instrumented using the mean of each gender and age characteristic in other charities of the same classification, in each year. Whether classifying using my ICNPO mapping or the underlying SIC codes, these had weak first stages. Others (e.g. Conyon & He, 2017) instrument using demographics of the areas that surround organisations. I implemented this using ONS (2020) population data, focussing on charities operating from one postcode. Given gender
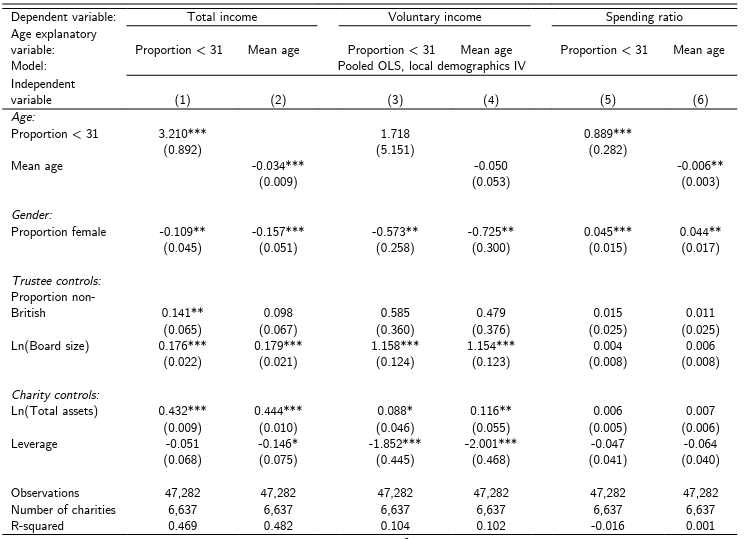
balance is often near parity and demographic change is gradual, these have weak first stages when instrumenting for gender or including charity fixed effects. Using pooled OLS estimation, proportion aged under 31 and mean age do have strong first stages, so for completeness these are reported in Appendices 6-7. Given the difficulty of identifying truly exogenous instruments, the possibility of dynamic endogeneity, and the chance that control variables are also endogenous, Wintoki et al. (2012) encourage the use of dynamic panel GMM estimators in corporate governance research. I explored Arellano–Bover/Blundell–Bond 2Prior literature has not faced all female boards, for which the instrument is undefined, but these are 1.9% of my sample. I set its value to 1 in these cases, but results are not sensitive to alternative specifications (Appendix 5). The same applies for instrumenting age, though only 48 observations have all-young boards.
(Roodman, 2009) two-step system GMM estimation, but could not find a specification that passed tests of overidentifying restrictions and appropriate serial correlation.
4.2 Propensity score matched difference-in-differences
I also conduct a propensity score matched difference-in-differences estimation of the average treatment effect (ATE) of a charity recruiting its first ever trustee aged under 31. This allows the identification of effects that may take years to materialise, as trustees build influence. It also mitigates any concerns that the ‘proportion aged under 31’ and ‘mean age’ variables in my core model change mechanically year-on-year as trustees age. In the vein of Gong and Girma (2020), I define a treatment group of charities (=! = 1) which appoint their first trustee(s) aged under 31 during any year t in 2008-15 (n=609), and a control (=! = 0) of those which at the end of 2018 had never had such a trustee (n=2,838). Time is defined relative to the treatment year, t, which corresponds to different calendar years for different charities3. Following Gong and Girma (2020), I set the reference year t for the control charities to be the median year each is in-sample. I label this the ‘median year’ approach.
The hypothetical ideal estimation, using the potential outcomes framework (Rubin, 1974)
ATE= E[Yi (0)]
Where Yi=Fin Per Fi(t+s)-Fin perf it ,Yi (1) are potential outcomes if a charity did recruit a first young trustee, and B!(0) if they did not. The ATE is the causal effect of recruiting a first young trustee on the change in financial performance between the treatment year and s years forward amongst all sampled charities that did not recruit a young trustee before 2008. I estimate for 9 = 1,2,3. It is not possible to determine the ATE directly, because both potential outcomes are never observed for a single charity. However, it can be estimated under the conditional mean independence assumption (CMIA), a weaker version of the conditional independence assumption (CIA). It states that mean potential outcomes are independent of treatment after conditioning on 5!, a vector of variables that determine selection into treatment. This is made more credible by the difference-in-differences design, where the outcome is the change in financial performance, which eliminates time-invariant differences in outcomes between treated and control charities (Smith & Todd, 2005). If the CMIA holds:
ATE =E[Y(i)|Ti= 1,Xi] -E[Yi(0)|Ti=0,xi]
I choose 5! to comprise all independent and dependent variables from my core model in year K − 1, one year before treatment. Conditioning exactly on so many variables is not feasible, but Rosenbaum and Rubin (1983) demonstrate that adjusting for a scalar propensity score removes bias induced by all of them. The propensity score, P(Xi)=Pr(Ti=1Xi), is the probability of being treated, conditional on 5!. Therefore:
ATE =E [Yi(i)| Ti= I,P(Xi)] – E [Yi(0)|Ti=o,p(Xi)]
iestimate propensity scores using a logit model. I then obtain ATE estimates using nearest neighbour matching with one neighbour and replacement, which matches each charity with the one of opposite
3For example, year t-1 refers to 2007 for a charity that appoints its first trustee aged under 31 in 2008, and 2013 for one that does so in 2014.
treatment status with the closest propensity score. Using a single neighbour reduces finite sample biases caused by poor matches (Abadie & Imbens, 2016), and performs well in simulations (Austin, 2010). Then:
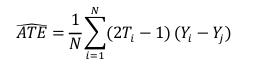

where O is the unit matched to “, and M is the total number of units (Abadie & Imbens, 2016).
For this to be unbiased, the overlap assumption must also be satisfied: propensity scores must be bounded
away from zero and one (Grilli & Rampichini, 2011). The SUTVA should hold too, which states potential
outcomes do not depend on other charities’ treatment statuses.
To explore the sensitivity of my results to the matching estimator, I also use the augmented inverse
probability weighting (AIPW) approach. This combines inverse probability weighting to model the treatment
probability, where observations are weighted by the inverse of their propensity score, with a regression model
of the outcome (Glynn & Quinn, 2010). The ATE estimate is consistent if either model is correct.
The CMIA is perhaps more credible if, in the nearest-neighbour specification, treated charities are matched
with control charities whose t is set to be the same calendar year. I label this the ‘same year’ approach.
A parallel methodology cannot be followed for estimating the effect of a first female trustee, because just 171
charities would comprise the treatment group and 122 the control.
5. Results
5.1 Core model
Tables 7-9 report results from the core regressions, estimated using pooled OLS, random effects, fixed effects, and instrumental variable methods. The pooled OLS estimates are the closest parallel to the prior cross-sectional non-profit literature. These suggest that a 10% increase in the proportion of trustees aged under 31, nearly a one-person increase on a mean-sized board of eight, is associated with a 3.2% increase in total income and an implausibly large 505% increase in voluntary income, all else equal4. Both are statistically significant at the 1% level. The sign and significance of the latter is consistent with Siciliano (1996). They construct the dependent variable as total donations ÷ total revenue, so I confirm this result holds when I do the same (Appendix 8). Pooled OLS estimates similarly suggest that a younger mean age is statistically significantly associated with higher total
and voluntary income. A 10% decrease in mean age is linked to a 0.07% and 0.21% increase in each, respectively. Conversely, an increase in standard deviation of age is statistically significantly associated with a fall in total income, though the effect is small and statistically insignificant for voluntary income. There is no statistically significant relationship between young trustees or mean age and the spending ratio, though age diversity is associated with a very small increase in the spending ratio, statistically significant at the 5% level.
4These and subsequent interpretations are calculated using the exponential function as coefficients are
frequently sufficiently large to invalidate the approximation of In (1 + x) ≈ ..x
Pooled OLS results for female trustees are highly inconsistent, as per Harris (2014). A 10% increase in the proportion of female trustees is linked to a 4.9-5.88% fall in voluntary income, a 0.78-0.79 percentage point
increase in the spending ratio, and has no statistically significant relationship with total income. The negative relationship with voluntary income is again consistent with Siciliano (1996).
However, statistical tests confirm pooled OLS estimation is likely inappropriate. Under the assumption that if a charity-specific time-invariant unobservable (a!) is present it is uncorrelated with all independent variables in all time periods, as random effects models require, pooled OLS estimation is still consistent (Wooldridge, 2018). However, the composite error term (Vi=ai+Uit) becomes serially correlated so standard errors and inferences drawn from them are incorrect. The Breusch and Pagan (1980) Lagrange multiplier test rejects the null hypothesis that the variance of a! equals zero in every specification, suggesting the random effects model should be preferred to pooled OLS5. A Hausman test comparing random effects and fixed effects
models, the latter permitting correlation between a! and independent variables, finds coefficient estimates are systematically different in all specifications. This thus provides indicative evidence that both the pooled OLS and random effects estimates are not consistent.
Using fixed effects estimation, the previously highly statistically significant effects of the proportion of trustees aged under 31 and female trustees on voluntary income, in line with Siciliano (1996), become statistically insignificant. Indeed, no trustee age or gender coefficients for voluntary income or the spending ratio retain statistical significance. Three statistically significant coefficients are apparent in the total income model. The previously positive association of young trustees with total income becomes negative and is only statistically significant at the 10% level. It does not survive even the mildest attempts to correct for multiple hypothesis testing. The corresponding Benjamini Krieger Yekutieli (2006) sharpened-q value which accounts for the false discovery rate, considering the nine age-related coefficients obtained by fixed effects estimation6, is 0.52. The magnitude and statistical significance of the coefficient on standard deviation of age shrinks and again is not robust to this modest multiple testing correction. The magnitude of the female proportion coefficients in the total income model are similar to the pooled OLS estimates, and the standard errors lower. In two of the age specifications they are only statistically significant at the 10% level, however, with one significant at 5%. It appears that the statistically significant pooled OLS estimates are largely driven by unobserved charity-level time-invariant factors, which the fixed effects model eliminates, though there is weak evidence of a positive association of female trustees with total income.
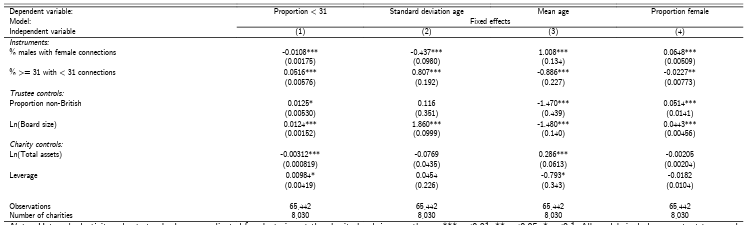
Table 10 reports the first stages estimated when employing the director connections instruments. That they act in the expected direction in all cases, and are statistically significant at the 0.01% level, supports their relevance. It is curious that the age instrument is associated with lower female representation and vice versa7. The Cragg-Donald Wald F statistic and the robust Kleibergen-Paap rk Wald F statistic (Clemens, 2013) exceed the relevant Stock-Yogo (2005) critical value for 10% maximal relative bias, except when mean age 5Wooldridge (2018) argues this test demonstrates little, for reasons including that it effectively detects any serial correlation in the composite error term, caused by a! or not. 6Values obtained using a script by Anderson (2007). Choice of a particular correction for multiple testing, and how many tests to account for, is highly subjective, so I do not employ it routinely.
7Young trustees are not more likely to be male, as this might imply. In 2018, 50.0% of trustees in the sample
aged under 31 were female, compared to 38.5% of those aged 31 and above.
(and female proportion, together) are instrumented. Appendix 9 reports these statistics. Therefore, given the bias 2SLS estimation can introduce with weak instruments, I do not report IV estimates for the mean age models. As the models are exactly identified, I cannot conduct a Sargan-Hansen test. When utilising the instruments, still including charity fixed effects, the age explanatory variables that retained some statistical significance in the fixed effects specification for total income become statistically insignificant. This reaffirms their interpretation as artefacts of multiple testing. The proportion of female trustees is positively associated with total income, statistically significant at the 5% level, in the model with proportion aged under 31. However, in the model with standard deviation of age the female coefficient is statistically insignificant. This result is therefore highly sensitive to model specification, and overall fails to provide compelling evidence of a gender effect on total income. The ‘trustee connections’ instruments thus do not
find evidence of a consistent effect of trustee age or gender on financial performance. Briefly addressing the control variables, the signs and statistical significance of the charity-level controls are similar across models. Total assets are positively associated with all three performance measures, in line with Harris (2014), and leverage is negatively associated with voluntary income. It might be that borrowing reduces the necessity of securing donations in the following year or improves capacity to generate income through charitable or trading activities. Trustee-level control estimates are a little less consistent. Larger boards have a positive relationship with total and voluntary income, but a negative association with the spending ratio when charity fixed effects are included. Non-British trustees seemingly have no relationship with financial performance, aside from perhaps a weak negative association with voluntary income.
TABLE 7 — CORE MODEL: TOTAL INCOME

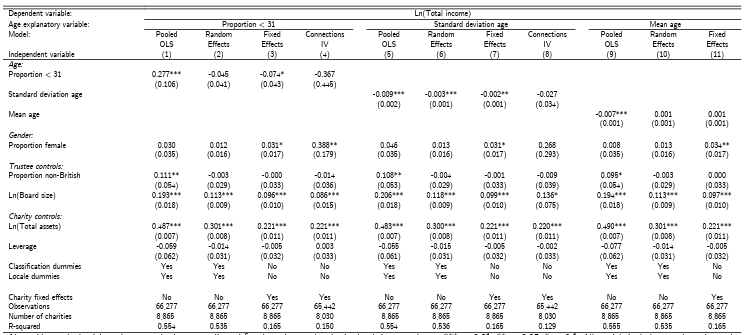
TABLE 8 — CORE MODEL: VOLUNTARY INCOME

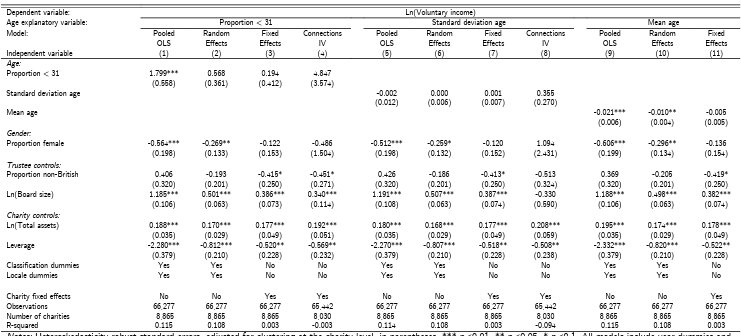
TABLE 9 — CORE MODEL: SPENDING RATIO


TABLE 10 — CONNECTIONS INSTRUMENTS: FIRST STAGES

5.2 Propensity score matched difference-in-differences
Table 11 shows logit regressions used to estimate propensity scores for the median year and same year samples. Having a lower mean trustee age or higher trustee age diversity in the prior year increases the probability of recruiting a first young trustee, as might be expected. Propensity increases with the proportion of female trustees and board size, and falls with the proportion non-British and total assets.
Tables 12 and 13 show standardised differences and variance ratios for the median year and same year samples, respectively, demonstrating how well matching improves covariate balance. Matching very successfully improves balance in the median year sample, with all standardised differences being under the common benchmark of 0.1 (Austin, 2009) when using nearest neighbour matching or AIPW. Only one variance ratio is outside the oft-cited range of 0.5-2 (Stuart, 2010). It performs nearly as well using the same year sample, reducing the number of covariates with unacceptable standardised differences from 13 to one. There are four variance ratios outside the ideal range, though two are only marginally. Figure 3 further demonstrates good propensity score overlap between treated and control groups, implying sufficient common support for reliable ATE estimation. Table 14 contains the ATE estimate
on the change in financial performance between the treatment year and one, two, and three years forward. The coefficient signs are not consistent, and only two effects are statistically significant. Using the median year sample, there is a negative effect of recruiting a first trustee aged under 31 on voluntary income in the subsequent year when using nearest neighbour matching, and a negative effect on the spending ratio three years forward when using nearest neighbour matching or AIPW.
Neither are robust to matching treatment and control charities using the same reference calendar year.
Nevertheless, because the latter is robust to both matching methods using the median year sample, I conduct
a sensitivity test of whether it is likely to be driven by selection on unobservables. I use the recently developed
concept of conditional c-dependence (Masten & Poirier, 2018). This relaxes the CIA by supposing:
IP(Ti=|Yi=Yt,Xi)-P[Ti=1|Xi=Xi)|<c for all Xi,l=0 and 1 ,c ∈ [0,1]
If the CIA holds, / is zero. Figure 4 illustrates how the bounds of the ATE in question vary with /. The breakdown point, the value of / beyond which the bounds include zero, is just 0.006. To interpret this result, Figure 4 includes plots that indicate the maximum change in propensity scores induced by excluding each covariate in turn. Masten & Poirier (2018) argue this leave-one-out analysis provides a benchmark of the level of c-dependence unobservables might induce. The breakdown point is substantially lower than the c dependence levels implied by all these benchmarks, confirming this effect is not robust. Overall, propensity score matched difference-in-difference estimation finds no robust effect of recruiting a first young trustee on a charity’s financial performance, even after several years.
TABLE 11 — LOGIT REGRESSIONS OF TREATMENT STATUS

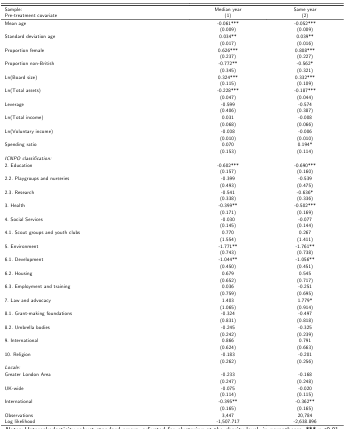
trustee aged under 31 in the following year, and 0 if the charity has never had a trustee aged under 31. Explanatory variables are measured the year before treatment. Omitted base ICNPO classification is “1. Culture and recreation”, and omitted locale is “local”. Median year sample includes control charities once using the median calendar year they are in sample as their reference (5) year, same year includes control charities using every calendar year 2008-2015 in turn.
TABLE 12 — PRE-TREATMENT COVARIATE BALANCE STATISTICS: MEDIAN YEAR SAMPLE

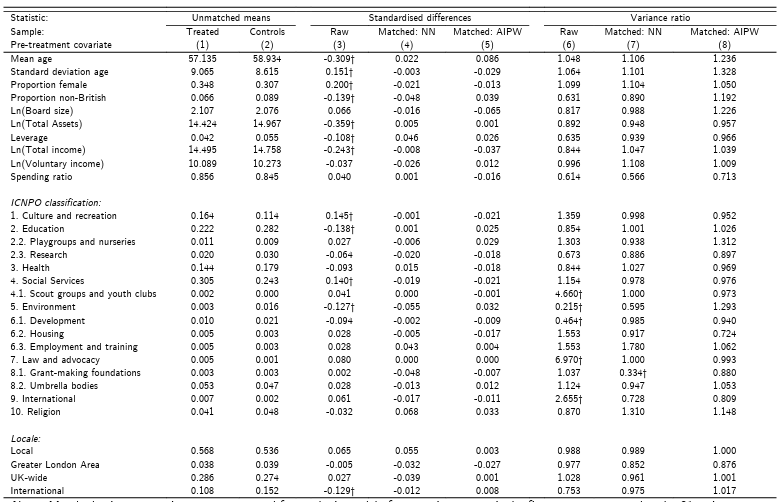
neighbour matching with one neighbour (NN) and augmented inverse-probability weighting (AIPW). The reference (!) calendar year for control charities is the median year they are present in the sample. Standardised differences weight the difference in covariate means between treatment and control groups by the square root of the mean of their variances. Variance ratios are the mean ratio of the variance of each covariate between treated and control charities (Austin, 2009). † indicates standardised differences > 0.1, and variance ratios >2 or < 0.5.
TABLE 13 — PRE-TREATMENT COVARIATE BALANCE STATISTICS: SAME YEAR SAMPLE

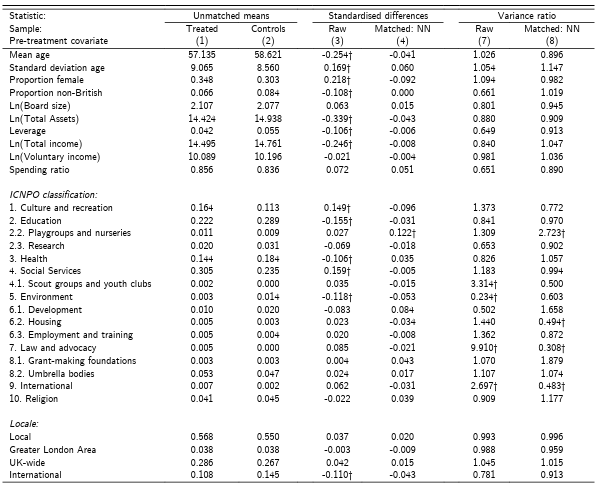
aged under 31, using nearest neighbour matching with one neighbour (NN). Control charities are included using
every calendar year 2008-2015 as their reference year (!) in turn. Standardised differences weight the difference
in covariate means between treatment and control groups by the square root of the mean of their variances.
Variance ratios are the mean ratio of the variance of each covariate between treated and control charities (Austin, 2009). † indicates standardised differences > 0.1, and variance ratios >2 or <0.5.
FIGURE 3 — PROPENSITY SCORE OVERLAP

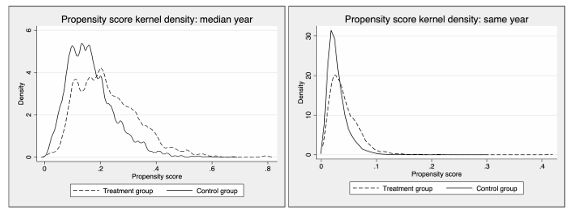
are present in the sample, same year includes control charities using every calendar year 2008-2015 as their reference in turn.
TABLE 14 — AVERAGE TREATMENT EFFECT ESTIMATES

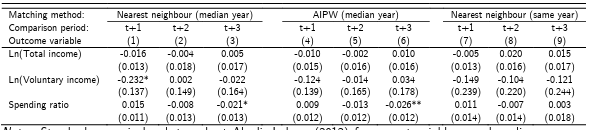
sample, robust Abadie-Imbens (2011) for nearest neighbour and same year sample, and robust to clustering
at the charity level for AIPW. Estimates are the average treatment effects of recruiting a first trustee aged
under 31 on the change in each financial performance measure between the comparison period and period !.
Estimates are generated using nearest neighbour matching with one neighbour and augmented inverse
probability weighting (AIPW). Median year sample includes control charities once using the median calendar
year they are in-sample as their reference (!) year, same year includes control charities using every calendar year 2008-2015 in turn.
FIGURE 4 — SENSITIVITY ANALYSIS

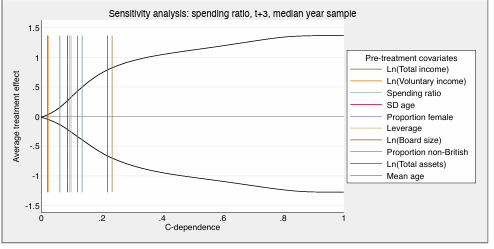
the spending ratio between ! and ! +3, using the median year sample. Black lines show the bounds of the
ATE implied by different levels of conditional c-dependence (Masten & Poirier, 2018). Vertical lines show
the maximum change in propensity score that would be induced by leaving out the pre-treatment covariate
indicated, as benchmarks of the level of c-dependence leaving out each would imply.
5.3 Robustness and extensions
I
now briefly discuss seven robustness checks and extensions. Results tables, in the Appendix, show fixed effects and IV estimates only. Appendix 10 presents the baseline results in the same manner, to aid comparisons.
5.3.1 Data characteristics
As charities are highly heterogeneous, some variables have a few extreme observations that could drive estimates. I already mitigate the extreme positive skew of some variables by expressing them in natural logarithms. Going further, Appendix 11 presents results when the dependent variables, total assets and
leverage are winsorized at 1% and 99% of their sample distributions. Results are broadly unchanged. 14.1% of trustee genders are classified by first name. Although common in the literature (e.g. Ahern & Dittmar, 2012), this may not always be accurate, such as for unisex names, making the ‘proportion female’ variable imprecise and potentially disguising its true causal effect. Merely excluding charities with trustees whose genders cannot all be classified by their titles could increase sample selection bias. For example, health charities have more trustees titled “Dr”. Instead, Appendix 12 shows results after dropping any charity that has any trustee gender in any year that Genderize.io reports is predicted with less than 95% certainty or based on under 50 reference gender-name pairs. All fixed effects and IV estimates of the effect of the proportion of female trustees on total income, except one, become statistically insignificant, further evidence they are not robust. This could also be due to the lowering of statistical power, as the sample size reduces by 28%. A final dataset concern is that I only observe financial variables from the charity register when annual income exceeds £500,000, which could cause non-random sample entry and exit. Therefore, in Appendix 13 I use theFame database to exclude charities whose annual income falls below £500,000 in any year 2007-18. Total observations reduce by 18%, but the results are broadly consistent with the core estimates.
5.3.2 Subsamples
As I fail to find robust effects young or female trustees on financial performance when considering all charities, it is natural to consider whether effects do exist for particular charity types. In Appendix 14 I report results when including only the 5,038 charities which are involved with helping children and young people. One might imagine that in these charities young trustees would be particularly well placed to suggest improvements to services or new ways of engaging beneficiary groups that might improve total and voluntary income. The estimates do not support this hypothesis, with coefficients and their statistical significance almost identical to the core specification. Similarly, Appendix 15 tabulates results when only studying the 426 in-sample charities whose purpose includes advancing human rights, or promoting religious or racial harmony, or equality and diversity. This includes “the elimination of discrimination on the grounds of age, sex or sexual orientation” (Charity Commission, 2013). The estimates do not suggest any differential effect of age or gender diversity, with one of the two statistically significant age and gender coefficients only being very weakly so, and the other being economically insignificant.
5.3.3 Model specification
It might be that the ‘trustee connections’ instruments merely proxy for the overall connectedness of boards, violating the exclusion restriction. In line with Adams and Ferreira (2009), in Appendix 16 I thus include an additional control of the total number of external directorships that trustees hold. Results are generally robust, though it is notable that the magnitude of the effect of female proportion on total income in the proportion aged under 31 specification falls, and it is now statistically insignificant. This lends further credence to the original being unreliable. Although I do not find any robust effect of young or female trustees when considered separately, Appendix 17 includes an interaction term between proportion female and the age explanatory variables. All except one are statistically insignificant, and this result too becomes insignificant when using IV estimation. The sampled charities have higher mean female representation than in many firm studies: 35%, compared to 17% in the UK SMEs studied by Shehata et al. (2017), for example. Indeed, 18% of observations have a majority-female board. It is thus reasonable to consider a direct measure of gender diversity in place of ‘proportion female’. In Appendix 18 I thus use the Blau index which, here, gives the probability that two trustees selected at random from a board are of different genders (Rushton, 2008). The connections instrument for gender has a weak first stage when using this measure, so I only report fixed effects estimates. There are no statistically significant estimates of the effect of gender diversity on any financial performance measure.
6. Discussion
These results, which fail to find a robust effect of trustee age or gender on the financial performance of large UK charities, are compatible with several explanations. Firstly, it may be that there is a consistent effect of young and female trustees on charity financial performance, but it is insufficiently strong to be detected by econometric analysis. My study, with 320 times as many observations as the most comparable prior work, Elmagrhi et al. (2018), presents something of a best case for identifying an effect if this is true. Hermalin and Weisbach (2005) argue board characteristics should be modelled as leading to board actions, which in turn affect performance. They write (p. 12) that when estimating the direct link “errors from both underlying equations are present, so the signal-to-noise ratio is low”. Research of firms has begun to take heed, with Adams and Ferreira (2009) examining the impact of directors’ gender on board inputs such as attendance, and on governance characteristics such as the relationship between CEO turnover and stock performance. Future non-profit research should explore this avenue. In 2018 the Charity Commission (2018b) began publishing the number of employees of each charity receiving total benefits in different bands above £60,000. Once a few years have been released, effects of
trustee characteristics on top remuneration could be investigated, as an example. Secondly, it might be that young and female trustees do affect financial performance, but not in a consistent manner. Charities are highly heterogeneous in their charitable purposes, service provision, beneficiary groups, organisational structures, and financing mechanisms (Epstein & McFarlan, 2011). Adams (2019) argues that there are very few corporate strategies that have been shown to uniformly change firm value, and board diversity should not be held to a higher standard. Carter (2010) expresses a similar view in terms of contingency theory, which posits that the optimal way to run an organisation depends on circumstances (Fiedler, 1981). I have investigated some circumstances in which trustee characteristics may be particularly relevant for performance, i.e. charities working with young people or promoting diversity, but future research should explore others. It may also be that the age and gender characteristics of trustees are already at an efficient equilibrium in most trustee boards. Ahern and Dittmar (2012) provide evidence this can be the case in firms, demonstrating that a Norwegian quota for 40% female directors led to immediate stock price declines and medium-term falls in market value for firms most impacted. This is not possible to test without a similar
exogenous shock to trustee characteristics. A third possibility is that there is no causal effect of young and female trustees, recruited and integrated as they currently are, but that there could be if their appointment were more widespread. For example, of the observations where a positive number of trustees aged under 31 are on a board, in 75.8% of cases only one is present. It thus might be the case that young and female trustees are recruited as tokens of diversity, or “window dressing” (Carter et al., 2003, p. 44), and so do not have the influence to affect performance. There is some qualitative support for this, with a Charity Commission (2010, p. 21) report finding from focus groups that “not being taken seriously” is a key challenge facing young trustees. Selection effects must also be acknowledged. Adams and Ragunathan (2017) present evidence that despite prior findings that women are, on average, more risk averse than men, female directors of Swedish companies are less risk averse than male directors. Further research regarding the characteristics of the female and young individuals who are currently trustees would be valuable in illustrating if performance effects could differ if more were recruited.
Finally, it may simply be the case that trustee gender and age have no causal effect on charity performance. Board members may have negligible impact on outcomes, or age and gender may be inconsequential in determining what impact they do have. Ahern and Dittmar’s (2012) evidence suggests the former is not true for firms, and indeed they argue the lowering of the age and experience level of female directors recruited in response to the quotas may have caused the fall in performance. However, this evidence base is less established for non-profits.
7. Conclusion
This paper provides empirical evidence of the effect of the age and gender composition of trustee boards on the financial performance of charities. Such links are implied by UK regulators, sector leaders and campaign groups, but thus far have been largely untested. My dissertation finds no robust effect of the proportion of female trustees, proportion of trustees aged under 31, standard deviation of trustee age or mean trustee age on total income, voluntary income, or the ratio of charitable expenditure to total income. Some effects, consistent with prior research, are apparent in pooled OLS specifications, but are eliminated by the inclusion of charity fixed effects or the use of instrumental variables based on trustee connections to other directors. A propensity score matched difference-in-differences analysis confirms effects of recruiting a first young trustee are not evident even after they have had time to build influence on a board. These results are robust to different assumptions about my dataset and considering different subsamples and specifications. It thus makes several original contributions, as to the best of my knowledge there has been no previous research investigating any links between trustee age and non-profit performance that has not relied on cross-sectional regression, none examining a direct gender-performance link that has not relied on pooled OLS estimation, and none testing the effect of recruiting a first ever young trustee. It also pioneers a new combination of datasets that is richer and over three hundred times the size of that employed by the most similar prior research. This could help lower the barriers to entry for future non-profit governance research. Nevertheless, my study has limitations. I only provide evidence from the UK, and just as the effects of firm diversity board diversity can vary with cultural and institutional context (Post & Byron, 2015), they may do so similarly for charities. My data only covers large charitable companies, not other types of charities nor smaller ones, though this currently appears the only possible route with publicly available data. Mitigating endogeneity convincingly is highly challenging in this literature, and I have discussed the assumptions
underlying my instrumental variable strategy and why they might fail. It is also reasonable to imagine that variables other than gender and age are endogenous. Similarly, selection on unobservables is possible in my propensity score analysis. Attempts should continue to identify new instruments and natural experiments, in the for-profit and non-profit governance literatures, to achieve cleaner identification. It should also be noted that although I focus on financial performance, and financial means may reasonably translate into better achievement of charitable aims, ideally it this social performance that would be evaluated directly. Because charities are so heterogeneous the nature of successful financial performance, particularly regarding spending ratios, can also vary greatly. Consistently measuring performance is a broader challenge in non-profit research (Crutchfield & Grant, 2012).
My results have several implications. They demonstrate the importance of non-profit research following the more mature for-profit literature in adopting panel data methods and identification strategies to demonstrate more plausibly causal relationships. It is important to note that I do not find any negative effect of young or female trustees on financial performance. However, those advocating trustee diversity based on uniformly positive performance effects, explicitly or implicitly, should perhaps reconsider their case. Many other arguments remain, including a moral case for equal opportunities and being representative of communities served, and developing the skills of future charity leaders. Policy, especially if mandates such as diversity quotas are being considered, should be written based on evidence rather than supposition. Does difference help make a difference? Perhaps, but different approaches are needed to prove it.
8. References
Abadie, A. & Imbens, G., 2011. Bias-corrected matching estimators for average treatment effects. Journal of Business
& Economic Statistics, 29(1), pp. 1-11.
Abadie, A. & Imbens, G., 2012. Matching on the estimated propensity score: Harvard University and National Bureau
of Economic Research. [Online]
Available at: https://www.nber.org/papers/w15301
[Accessed 5 April 2021].
Abadie, A. & Imbens, G., 2016. Matching on the estimated propensity score. Econometrica, 84(2), pp. 781-807.
Adams, R., 2019. Women on boards: The superheroes of tomorrow?. [Online]
Available at: https://www.youtube.com/watch?v=qrgBr52LcVs
[Accessed 5 April 2021].
Adams, R. & Ferreira, D., 2009. Women in the boardroom and their impact on governance and performance. Journal
of Financial Economics, 94(2), pp. 291-309.
Adams, R. & Ragunathan, V., 2017. Lehman Sisters. SSRN: https://ssrn.com/abstract=3046451.
Ahern, K. & Dittmar, A., 2012. The Changing of the Boards: The Impact on Firm Valuation of Mandated Female
Board Representation. Quarterly Journal of Economics, 127(1), pp. 137-197.
Ali, M., Ng, Y. L. & Kulik, C., 2014. Board Age and Gender Diversity: A Test of Competing Linear and Curvilinear
Prediction. Journal of Business Ethics, Volume 125, pp. 497-512.
Anderson, M., 2007. Stata code to compute “sharpened” False Discovery Rate (FDR) adjusted q-values. [Online]
Available at: http://are.berkeley.edu/~mlanderson/downloads/fdr_sharpened_qvalues.do.zip
[Accessed 5 April 2021].
Ararat, M., Aksu, M. & Cetin, A., 2015. How Board Diversity Affects Firm Performance in Emerging Markets:
Evidence on Channels in Controlled Firms. Corporate Governance: An International Review, 23(2), pp. 83-103.
Austin, P., 2009. Balance diagnostics for comparing the distribution of baseline covariates between treatment groups in
propensity-score matched samples. Statistics in Medicine, 28(25), pp. 3083-3107.
Austin, P., 2010. Statistical Criteria for Selecting the Optimal Number of Untreated Subjects Matched to Each Treated
Subject When Using Many-to-One Matching on the Propensity Score. American Journal of Epidemiology, 172(9), pp.
1092-1097.
Bascle, G., 2008. Controlling for endogeneity with instrumental variables in strategic management research. Strategic
Organisation, 6(3), pp. 285-327.
Baum, C., Schaffer, M. & Stillman, S., 2010. ivreg2: Stata module for extended instrumental variables/2SLS, GMM
and AC/HAC, LIML and k-class regression.. [Online]
Available at: http://ideas.repec.org/c/boc/bocode/s425401.html
[Accessed 1 May 2021].
Benjamini, Y., Krieger, A. M. & Yekutieli, D., 2006. Adaptive Linear Step-up Procedures that Control the False
Discovery Rate. Biometrika, 93(3), pp. 491-507.
Boateng, A., Akamavi, R. & Ndoro, G., 2016. Measuring performance of non-profit organisations: evidence from large
charities. Business Ethics: A European Review, 25(1), pp. 59-74.
Bonn, I., Yoshikawa, T. & Phan, P., 2004. Effects of board structure on firm performance: A comparison of Japan and
Australia. Asian Business & Management, 3(1), pp. 105-125.
Borjas, G., 2016. Labor Economics. 7th ed. New York: McGraw-Hill Education.
Breusch, T. S. & Pagan, A. R., 1980. The Lagrange Multiplier Test and its Applications to Model Specification in
Econometrics. The Review of Economic Studies, 47(1), pp. 239-253.
Buse, K., Bernstein, R. S. & Bilimoria, D., 2016. The Influence of Board Diversity, Board Diversity Policies. Journal of
Business Ethics, Volume 133, pp. 179-191.
BVD, 2020. Fame: the leading UK company research solution. [Online]
Available at: https://fame.bvdinfo.com/
[Accessed 29 November 2020].
Callen, J., Klein, A. & Tinkelman, D., 2009. The Contextual Impact of Nonprofit Board Composition and Structure on
Organizational Performance: Agency and Resource Dependence Perspectives. VOLUNTAS, Volume 21, pp. 101-125.
Campbell, K., Minguez-Vera & Antonio, 2007. Gender Diversity in the Boardroom and Firm Financial Performance.
Journal of Business Ethics, Volume 83, pp. 435-451.
Carter, D., D’Souza, F., Simkins, B. & Simpson, G., 2010. The Gender and Ethnic Diversity of US Boards and Board
Committees and Firm Financial Performance. Corporate Governance: An International Review, 18(5), pp. 396-414.
Carter, D., Simkins, B. & Simpson, G., 2003. Corporate Governance, Board Diversity, and Firm Value. The Financial
Review, Volume 38, pp. 33-53.
Charities Aid Foundation, 2015. Young Trustees Guide: Developing the next generation of charity leaders. [Online]
Available at: https://www.cafonline.org/docs/default-source/about-us
publications/youngtrusteesreport_1682a_web_080915.pdf
[Accessed 28 November 2020].
Charity Commission, 2005a. The Essential Trustee: What you need to know. [Online]
Available at: https://www.ihbc.org.uk/recent_papers/docs/Charity_Commission.pdf
[Accessed 28 November 2020].
Charity Commission, 2005b. Start as you mean to go on: Trustee recruitment and induction report. [Online]
Available at:
https://assets.publishing.service.gov.uk/government/uploads/system/uploads/attachment_data/file/284724/rs10text.p
df
[Accessed 2 May 2021].
Charity Commission, 2010. A Breath of Fresh Air: young people as charity trustees. [Online]
Available at:
https://assets.publishing.service.gov.uk/government/uploads/system/uploads/attachment_data/file/284702/rs23text.p
df
[Accessed 28 November 2020].
Charity Commission, 2013. Guidance: Charitable Purposes. [Online]
Available at: https://www.gov.uk/government/publications/charitable-purposes/charitable-purposes
[Accessed 5 May 2021].
Charity Commission, 2014. Charities Financial Reporting Standards: SORP (FRS 102), First Edition. [Online]
Available at: https://www.charitysorp.org/media/619101/frs102_complete.pdf
[Accessed 5 April 2021].
Charity Commission, 2018a. Recent charity register statistics: Charity Commission. [Online]
Available at: https://www.gov.uk/government/publications/charity-register-statistics/recent-charity-register-statistics
charity-commission
[Accessed November 28 2020].
Charity Commission, 2018b. New questions in the 2018 and 2019 charity annual return service. [Online]
Available at: https://www.gov.uk/government/news/charity-annual-return-2018
[Accessed 10 April 2021].
Charity Commission, 2020a. Search the charity register. [Online]
Available at: https://www.gov.uk/find-charity-information
[Accessed 29 November 2020].
Charity Commission, 2020b. The Register of Charities: Notes for users, Income. [Online]
Available at:
http://apps.charitycommission.gov.uk/Showcharity/ShowCharity_Help_Page.aspx?ContentType=Chart_Help_Incom
e&SelectedLanguage=English
[Accessed 4 December 2020].
Clemens, M., 2013. Blunt Instruments: Avoiding Common Pitfalls in Identifying the Causes of Economic Growth:
Online-only appendix. American Economic Journal: Macroeconomics, 5(2), pp. 152-186.
Companies House, 2020. Companies House API. [Online]
Available at: https://developer.company-information.service.gov.uk/api/docs/
[Accessed 29 November 2020].
Companies House, 2021. Companies House Developer Forum. [Online]
Available at: https://forum.aws.chdev.org/
[Accessed 10 March 2021].
Conyon, M. & He, L., 2017. Firm performance and boardroom gender diversity: A quantile regression approach.
Journal of Business Research, Volume 79, pp. 198-211.
Cornforth, C., 2012. Nonprofit Governance Research: Limitations of the Focus on Boards and Suggestions for New
Directions. Nonprofit and Voluntary Sector Quarterly, 41(6), pp. 1116-1135.
Crutchfield, L. & Grant, H., 2012. Forces for Good: The Six Practices of High-Impact Nonprofits. s.l.:John Wiley &
Sons.
Darmadi, S., 2011. Board diversity and firm performance: the Indonesian evidence. Corporate Ownership and Control,
Volume 8.
Demografix ApS, 2020. Genderize.io: Determine the gender of a name. [Online]
Available at: https://genderize.io/
[Accessed 29 November 2020].
Elmagrhi, M. et al., 2018. Trustee board diversity, governance mechanisms, capital structure and performance in UK
charities. Corporate Governance, 18(3), pp. 478-508.
Epstein, M. & McFarlan, W., 2011. Measuring the efficiency and effectiveness of a nonprofit’s performance. Strategic
finance, 93(4), pp. 27-34.
Faleye, O., 2007. Classified boards, firm value, and managerial entrenchment. Journal of Financial Economics, 83(2),
pp. 501-529.
Farrell, K. & Hersch, P., 2005. Additions to corporate boards: the effect of gender. Journal of Corporate Finance,
11(1-2), pp. 85-106.
Fernández-Temprano, M. & Tejerina-Gaite, F., 2020. Types of director, board diversity and firm performance.
Corporate Governance, 20(2), pp. 324-342.
Fiedler, F., 1981. Leadership effectiveness. American Behavioral Scientist, 24(5), pp. 619-632.
Garcia‐Rodriguez, I., Romero‐Merino, Elena, M. & Santamaria‐Mariscal, M., 2020. The role of boards in the financial
vulnerability of nonprofit organisations. Financial Accountability & Management in Governments, Public Services and
Charities.
Glynn, A. & Quinn, K., 2010. An Introduction to the Augmented Inverse Propensity Weighted Estimator. Political
Analysis, 18(1), pp. 36-56.
Gong, Y. & Girma, S., 2020. Top management gender diversity and performance: in search of threshold effects.
Cambridge Journal of Economics, Volume beaa045.
Grilli, L. & Rampichini, C., 2011. Propensity scores for the estimation of average treatment e ects in observational
studies. [Online]
Available at: https://www.bristol.ac.uk/media-library/sites/cmm/migrated/documents/prop-scores.pdf
[Accessed 10 April 2021].
Harris, E., 2014. The Impact of Board Diversity and Expertise on Nonprofit Performance. Nonprofit Management &
Leadership, 25(2), pp. 113-130.
Hermalin, B. & Weisbach, M., 2005. Boards of directors as an endogenously determined institution: A survey of the
economic literature. Economic Policy Review, 9(1), pp. 7-26.
Hillman, A., Cannella, A. & Paetzold, R., 2002. The Resource Dependence Role of Corporate Directors: Strategic
Adaptation of Board Composition in Response to Environmental Change. Journal of Management Studies, 37(2), pp.
235-256.
Hillman, A., Shropshire, C. & Cannella, A., 2007. Organizational Preditors of Women on Corporate Boards. The
Academy of Management Journal, 50(4), pp. 941-952.
Inclusive Boards, 2018. Charities: Inclusive Governance. [Online]
Available at: https://www.inclusiveboards.co.uk/wp-content/uploads/2019/10/Charities-Inclusive-Governance.pdf
[Accessed 29 November 2020].
Kunze, F., Boehm, S. & Bruch, H., 2011. Age diversity, age discrimination climate and performance consequences—a
cross organizational study. Journal of Organizational Behaviour, 31(2), pp. 264-290.
Larikov, A., 2021. update.py. [Online]
Available at: https://github.com/JuggleJobs/companies_house/blob/master/companies_house/update.py
[Accessed 5 April 2021].
Levi, M., Li, K. & Zhang, F., 2014. Director gender and mergers and acquisitions. Journal of Corporate Finance,
Volume 28, pp. 185-200.
Liu, Y., Wei, Zuobao & Zie, F., 2014. Do women directors improve firm performance in China?. Journal of Corporate
Finance, Volume 28, pp. 169-184.
Mahadeo, Jyoti, Soobaroyen, T. & Hanuman, V., 2012. Board Composition and Financial Performance: Uncovering the
Effects of Diversity in an Emerging Economy. Journal of Business Ethics, 105(3), pp. 375-388.
Masten, M. & Poirier, A., 2018. Identification of Treatment Effects Under Conditional Partial Independence.
Econometrica, 86(1), pp. 317-351.
McDonnell, D. & Rutherford, A., 2019. Promoting charity accountability: understanding disclosure of serious incidents.
Accounting Forum, 43(1), pp. 42-61.
Mishra, R. K. & Jhunjhunwala, S., 2013. Diversity and the Effective Corporate Board. 1st ed. Oxford: Academic Press.
Mistler, E., 2018. companies-house 0.1.2: Dynamic API wrapper for Companies’ House. [Online]
Available at: https://pypi.org/project/companies-house/
[Accessed 5 April 2021].
NCVO, 2020. How do we classify subsectors?. [Online]
Available at: https://almanac.fc.production.ncvocloud.net/about/subsector-classification/
[Accessed 5 April 2021].
ONS, 2019. Overview of the UK population: August 2019. [Online]
Available at:
https://www.ons.gov.uk/peoplepopulationandcommunity/populationandmigration/populationestimates/articles/overvie
woftheukpopulation/august2019
[Accessed 20 November 2020].
ONS, 2020. Population estimates by output areas, electoral, health and other geographies, England and Wales: mid
2019. [Online]
Available at:
https://www.ons.gov.uk/peoplepopulationandcommunity/populationandmigration/populationestimates/bulletins/annua
lsmallareapopulationestimates/latest
[Accessed 2 November 2020].
Pathan, S. & Faff, R., 2013. Does board structure in banks really affect their performance?. Journal of Banking &
Finance, 37(5), pp. 1573-1589.
Perkins, C. & Fields, D., 2010. Top Management Team Diversity and Performance of Christian Churches. Nonprofit
and Voluntary Sector Quarterly, 39(5), pp. 825-843.
Pfeffer, J. & Salancik, G., 1978. The external control of organizations: A resource dependence perspective. New York:
Harper & Row.
Post, C. & Byron, K., 2015. Women on Boards and Firm Financial Performance: A Meta-Analysis. Academy of
Management Journal, 58(5), pp. 1546-1571.
Reed, W., 2015. On the Practice of Lagging Variables to Avoid Simultaneity. Oxford Bulletin of Economics and
Statistics, 77(6), pp. 897-905.
Roodman, D., 2009. How to do xtabond2: An introduction to difference and system GMM in Stata. The Stata Journal,
9(1), pp. 86-136.
Rosenbaum, P. & Rubin, D., 1983. The central role of the propensity score in observational studies for causal effects.
Biometrika, 70(1), pp. 41-55.
Rubin, D., 1974. Estimating Causal Effects of Treatments in Randomized and Nonrandomized Studies. Journal of
Educational Psychology, 66(5), pp. 688-701.
Rushton, M., 2008. A note on the use and misuse of the racial diversity index. The Policy Studies Journal, 36(3), pp.
445-459.
Sayer, K., 2018. The best metrics for a charity are outcomes for beneficiaries. Third Sector, 27 March.
Shehata, N., Salhin, A. & El-Helaly, M., 2017. Board diversity and firm performance: evidence from the U.K. SMEs.
Applied Economics, 49(48), pp. 4817-4832.
Siciliano, 1996. The Relationship of Board Member Diversity to Organizational Performance. Journal of Business
Ethics, 15(12), p. 1996.
Smith, J. & Todd, P., 2005. Does matching overcome LaLonde’s critique of nonexperimental estimators?. Journal of
Econometrics, Volume 125, pp. 305-353.
Smith, N., Smith, V. & Verner, M., 2006. Do women in top management affect firm performance?A panel study of
2,500 Danish firms. International Journal of Productivity and Performance Management, 55(7), pp. 569-593.
Stock, J. & Yogo, M., 2005. Testing for Weak Instruments in Linear IV Regression. In: Identification and Inference for
Econometric Models. New York: Cambridge University Press, pp. 80-108.
Stone, M. & Ostrower, F., 2007. Acting in the Public Interest? Another Look at Research on Nonprofit Governance.
Nonprofit and Voluntary Sector Quarterly, 36(3), pp. 416-438.
Stuart, E., 2010. Matching methods for causal inference: A review and a look forward. Statistical science : a review
journal of the Institute of Mathematical Statistics, 25(1), pp. 1-21.
Talavera, O., Yin, S. & Zhang, M., 2018. Age diversity, directors’ personal values, and bank performance. International
Review of Financial Analysis, Volume 55, pp. 60-79.
Wais, K., 2016. Gender Prediction Methods Based on First Names with genderizeR. The R Journal, 8(1), pp. 17-37.
Wintoki, B., Linck, J. & Netter, J., 2012. Endogeneity and the dynamics of internal corporate governance. Journal of
Financial Economics, 105(3), pp. 581-606.
Wooldridge, J., 2018. Introductory Econometrics: A Modern Approach. 7th Edition ed. Boston: Cengage.
Young Trustees Movement, 2019. Press Release: The Young Trustees Movement: Will you pledge?. [Online]
Available at: https://www.iwill.org.uk/wp-content/uploads/2019/10/The-Young-Trustees-Movement-PRESS
RELEASE-.pdf
[Accessed 28 November 2020].
Young Trustees Movement, 2020. Benefits. [Online]
Available at: https://youngtrusteesmovement.org/benefits
[Accessed 28 November 2020].
9. Appendix
APPENDIX 1 — NOTES: COMPANIES HOUSE API I accessed the Companies House (2020) API using the ‘companies-house’ Python script by Elias Mistler (2018), incorporating a revision from Alexander Larikov (2021) to account for a change in the API’s reference URL (currently https://developer-specs.company information.service.gov.uk/companies-house-public-data api/reference). Drawing on a number of posts in the Companies House (2021) Developer Forum, I implemented rate-limiting using the “X-Ratelimit-Remain” and “X Ratelimit-Reset” headers to ensure only 600 requests were sent per five-minute period. I further automated the paging through of requests containing more than 100 items, added error handling for 502 and 500 errors, and cached queries to disk as they were retrieved. I am happy to share this modified package on request. I used the “list_company_officers” operation to retrieve the names, nationalities, months and years of birth, appointment dates, resignation dates and roles of all officers of the charities in my sample by their company number. I then used the unique officer identifiers (obtained from “items[].links.self”) for officers active in my period of interest to obtain their titles using “list_officers_appointments”. I classified trustees as male if they had the following titles: Mr, Sir, Lord, Baron, Brother, Count, Deacon, Duke, Earl, Father, Fr, His, Mister, Monsieur, Prince. I classified them female if their titles were: Mrs, Ms, Miss, Baroness, Countess, Viscountess, Duchess, Her, Lady, Princess, Dame, Sister. To construct my instrumental variables, I additionally used “list_officers_appointments” to obtain the company numbers of other companies each trustee in my sample sat on in the relevant period. I then used “list_company_officers” to obtain the details of all other directors of these other companies, again using “list_officers_appointments” for each of these to obtain their titles for gender classification.
APPENDIX 2 — CORE MODEL: SMOOTHED SPENDING RATIO

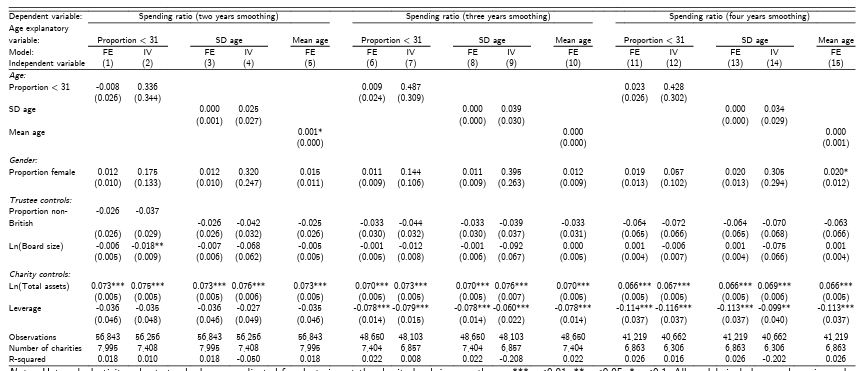
constant term. All independent variables are lagged by one year. FE models include charity-level fixed effects, IV models additionally use the proportion of male (aged 31 or over)
trustees sitting on another board with a female (aged under 31) trustee as an instrument for ‘proportion female’ (‘proportion < 31’ and ‘standard deviation age’). Dependent variables
are constructed using equally-weighted one-sided moving averages using the contemporary value and an additional one, two or three lead values.
APPENDIX 3 — CORE MODEL: ALTERNATIVE VOLUNTARY INCOME SPECIFICATIONS

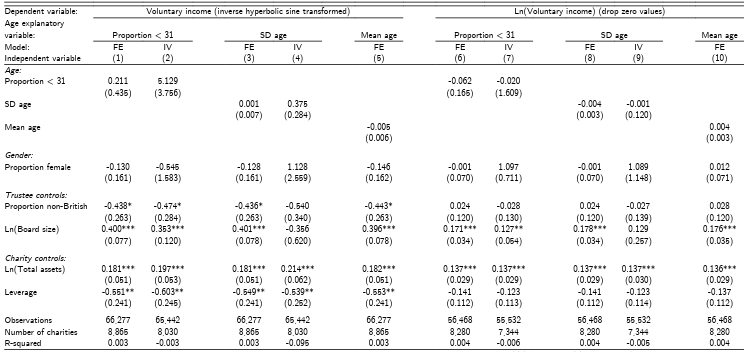
deviation. All models include year dummies and a constant term. All independent variables are lagged by one year. FE models include charity-level fixed effects,
IV models additionally use the proportion of male (aged 31 or over) trustees sitting on another board with a female (aged under 31) trustee as an instrument for
‘proportion female’ (‘proportion < 31’ and ‘standard deviation age’). To mitigate zero values of voluntary income while improving positive skew, columns 1-5
transform it by the inverse hyperbolic sine function, and columns 6-10 drop zero value observations before taking the natural logarithm.
APPENDIX 4 — CHARITY CLASSIFICATIONS SIC MAPPING

APPENDIX 5 — CORE MODEL: ALTERNATIVE INSTRUMENT SPECIFICATIONS

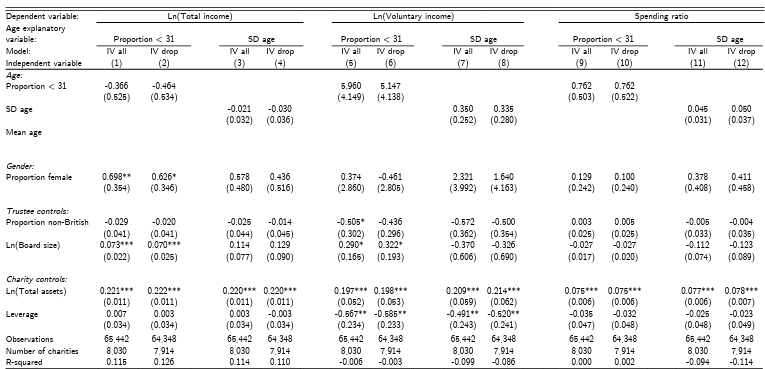
deviation. All models include year dummies and a constant term. All independent variables are lagged by one year. All models use the proportion of male (aged 31 or over) trustees sitting on another board with a female (aged under 31) trustee as an instrument for ‘proportion female’ (‘proportion < 31’ and ‘standard deviation age’). To deal with all female (all aged under 31) boards, the core model sets the instruments in these cases to 1. Here, ‘IV all’ columns use the proportion of all trustees, irrespective of their gender (age), sitting on another board with a female (aged under 31) trustee in those cases. ‘IV drop’ columns drop observations with all female or all young boards.
APPENDIX 6 — FIRST STAGES: LOCAL DEMOGRAPHICS INSTRUMENT

APPENDIX 7 — RESULTS: LOCAL DEMOGRAPHICS INSTRUMENT

APPENDIX 8 — CORE MODEL: VOLUNTARY INCOME ÷ TOTAL INCOME

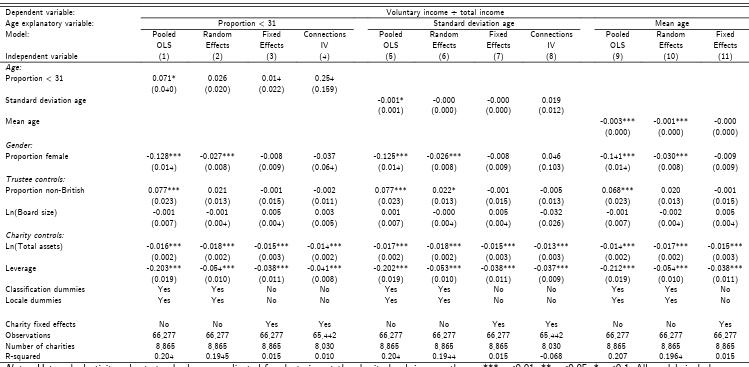
dummies and a constant term. All independent variables are lagged by one year. The connections IV models, which also include charity-level fixed effects, use the
proportion of male (aged 31 or over) trustees sitting on another board with a female (aged under 31) trustee as an instrument for ‘proportion female’ (‘proportion < 31’ and ‘standard deviation age’). Dependent variable is constructed in line with Siciliano (1996), for comparability.
APPENDIX 9 — CONNECTIONS IV: WEAK INSTRUMENT TESTS

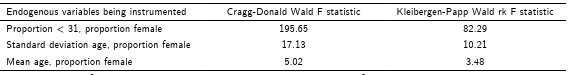
proportion of male (aged 31 or over) trustees sitting on another board with a female (aged under 31)
trustee as an instrument for ‘proportion female’ (‘proportion < 31’ and ‘standard deviation age’). The Kleibergen-Papp Wald rk F statistic is robust to errors being non-i.i.d. (Baum et al., 2010). The Stock-Yogo (2005) critical value for two instruments, two endogenous regressors, and 10% maximal relative bias is 7.03.
APPENDIX 10 — REFERENCE: CORE RESULTS

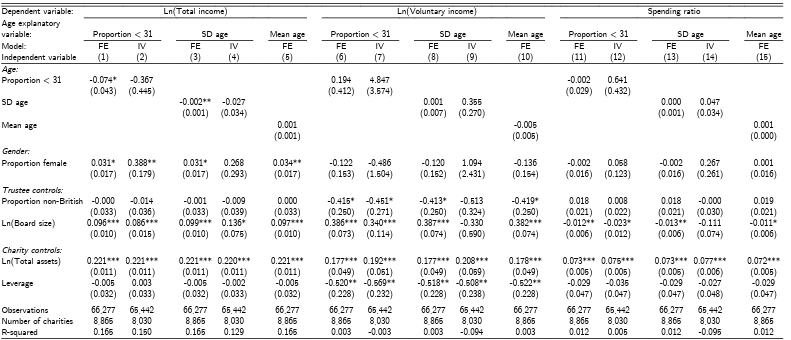
APPENDIX 11 — ROBUSTNESS: WINSORIZING KEY VARIABLES

![Notes: Heteroskedasticity-robust standard errors, adjusted for clustering at the charity level, in parentheses. *** p<0.01, ** p<0.05, * p<0.1. SD = standard deviation. All models include year dummies and a constant term. All independent variables are lagged by one year. FE models include charity-level fixed effects, IV models additionally use the proportion of male (aged 31 or over) trustees sitting on another board with a female (aged under 31) trustee as an instrument for ‘proportion female’ (‘proportion < 31’ and ‘standard deviation age’). [Winsor] indicates variables have been winsorized at 1% and 99% of their sample distributions.](https://thenews.uy/wp-content/uploads/2024/02/apendx-11.png)
APPENDIX 12 — ROBUSTNESS: STRICTER GENDER CLASSIFICATION

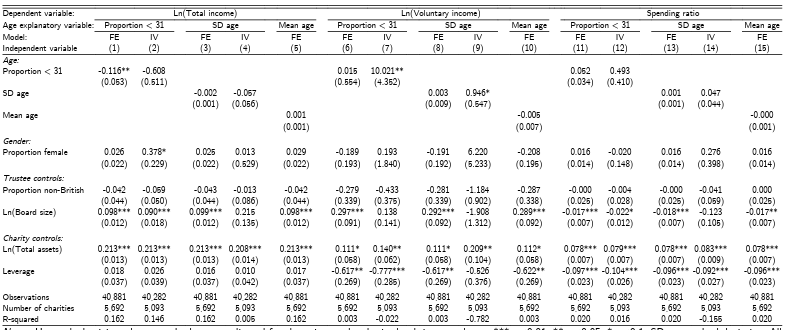
APPENDIX 13 — ROBUSTNESS: CHARITIES WITH TOTAL INCOME > £500,000 THROUGHOUT SAMPLE

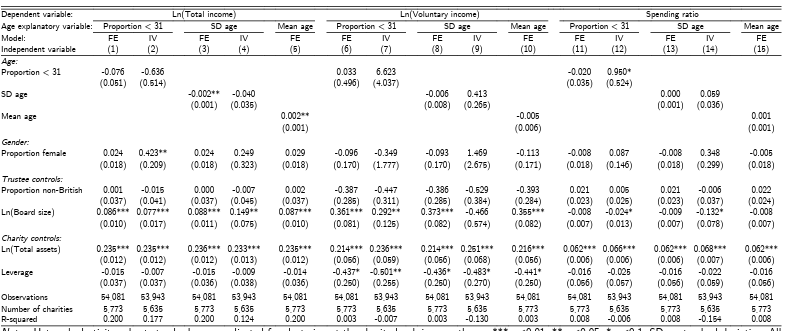
APPENDIX 14 — SUBSAMPLE: HELPS CHILDREN/YOUNG PEOPLE

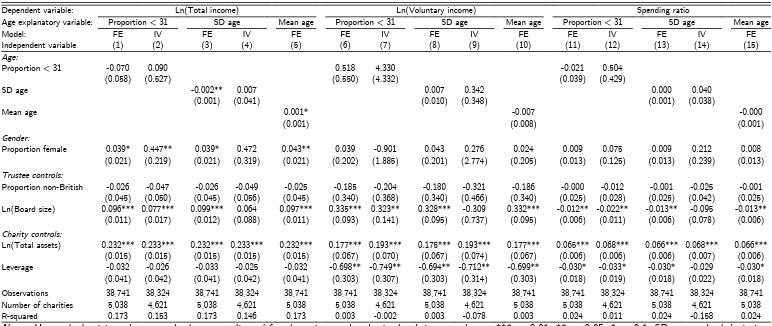
APPENDIX 15 — SUBSAMPLE: ADVANCES HUMAN RIGHTS, RELIGIOUS/RACIAL HARMONY, OR EQUALITY AND DIVERSITY

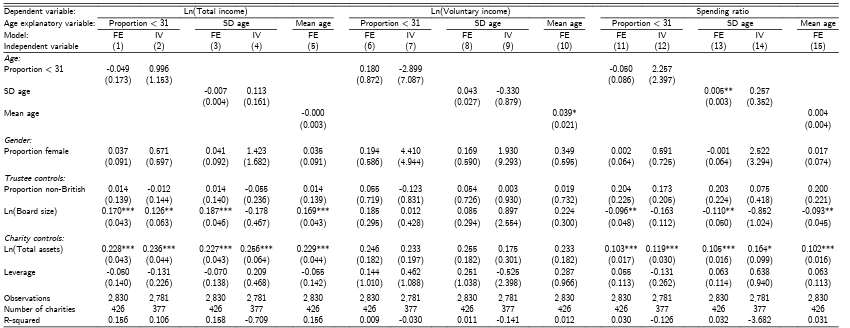
APPENDIX 16 — ROBUSTNESS: CONNECTIONS IV, CONTROLLING FOR TOTAL CONNECTIONS

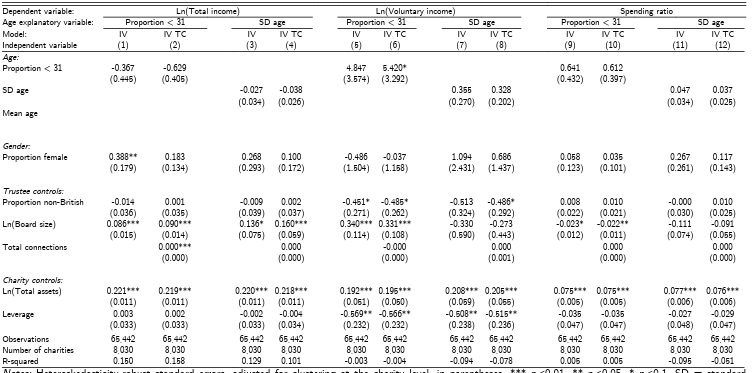
deviation. All models include year dummies and a constant term. All independent variables are lagged by one year. All models use the proportion of male (aged 31
or over) trustees sitting on another board with a female (aged under 31) trustee as an instrument for ‘proportion female’ (‘proportion < 31’ and ‘standard deviation age’). IV TC columns add an additional control of the total number of external directorships trustees on a board hold.
APPENDIX 17 — ROBUSTNESS: INTERACTION TERMS

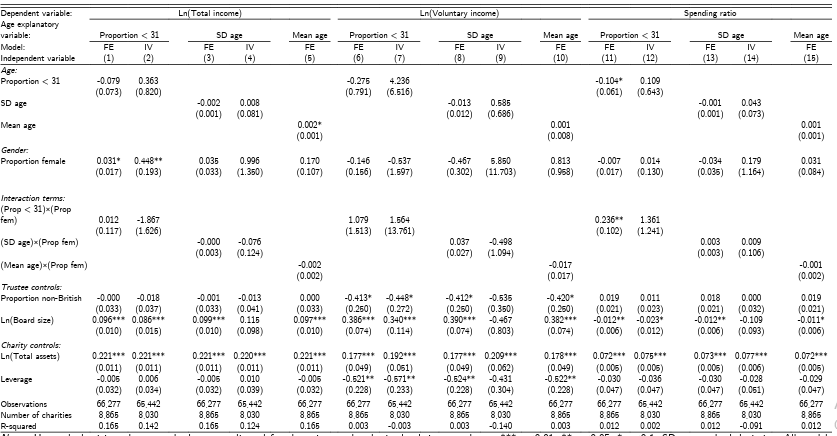
APPENDIX 18 — ROBUSTNESS: BLAU INDEX OF GENDER DIVERSITY

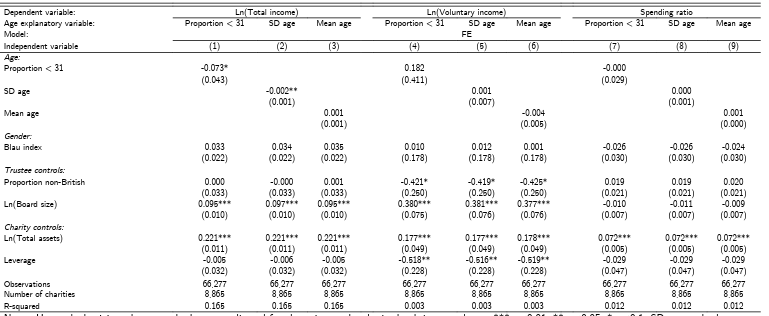
where % is the number of gender categories present in a charity and &! the proportion of trustees in each (Shehata et al., 2017).